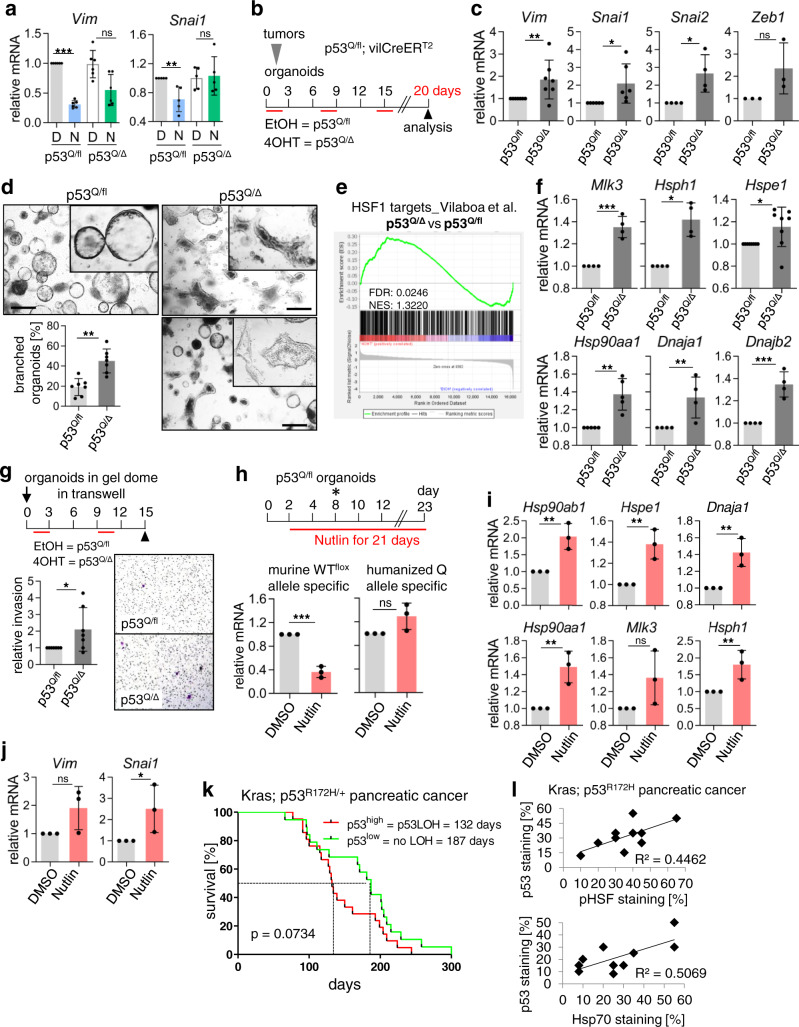
Fig. 7. In murine CRC organoids p53LOH de-represses HSF1 activity and triggers mutp53-driven invasion.
a mRNA levels of Vim and Snai1 of indicated organoids treated as in Fig. 2c. Two days after p53LOH induction organoids treated with 10 µM Nutlin/DMSO for 24 h were harvested for qRT-PCR and normalized to Hprt1 mRNA. Mean ± SD from ≥3 independent experiments of ≥3 cultures. b Treatment scheme used in c–e for “long-term p53LOH” (p53Q/Δ) of p53Q/fl;vilCreERT2 organoids over 20 days, induced by adding weekly 4OHT for 48 h (red lines). EtOH, control (no LOH, p53Q/fl). c mRNA levels of EMT markers in the indicated organoids generated in b. qRT-PCR normalized to Hprt1 mRNA. Mean ± SD of ≥3 independent experiments from two cultures. d Representative images of organoids. p53LOH induces branching, associated with invasiveness7. Quantifications of branched organoids per image field (4× magnification) as percentage of total organoid numbers. Nine to 15 images per condition were counted. Mean ± SD of seven independent experiments from two different cultures. e RNAs-eq analysis of EtOH-treated (p53Q/fl) and 4OHT-treated (p53Q/Δ) organoids. Enrichment plots for HSF1 target gene set from Vilaboa et al. generated on heat-shock-induced Hela cells64. f mRNA levels of HSF1 target genes of indicated organoids generated as in b. qRT-PCR normalized to Hprt1 or Rplp0 mRNA. Mean ± SD of ≥3 independent experiments from two cultures. g Organoid invasion assay. (Top) treatment scheme of p53Q/fl;vilCreERT2 organoids with weekly 4OHT or EtOH (red lines). (Right) representative images from the underside of transwells stained with crystal violet. (Left) quantifications of migrated cells. At least four fields per transwell were counted. Mean ± SD of five independent experiments from two different cultures. (h) Long-term chronic Nutlin treatment of heterozygous p53Q/fl;vilCreERT2 organoids used in h and i to induce spontaneous p53LOH. Two days after plating, organoids were treated with 5 µM Nutlin/DMSO for 21 days. At day 8, dead organoids were removed by splitting. See also Supplementary Fig. 7f. (Bottom) mRNA levels of the murine Trp53 allele and the humanized TP53 allele of heterozygous p53Q/fl;vilCreERT2 organoids using species-specific primers. qRT-PCR normalized to Hprt1 mRNA. Mean ± SD from two independent experiments, one included a technical replicate from the same organoid culture (total n = 3). i, j mRNA levels of HSF1 target genes (i) or EMT markers (j) of long-term Nutlin-treated organoids from h. qRT-PCR normalized to Hprt1 mRNA. Mean ± SD from two independent experiments, one with a technical replicate from the same organoid culture (total n = 3). k Survival curve of KPC mice stratified for p53high (p53LOH, n = 25 mice) versus p53low (no LOH, n = 15 mice). Kaplan–Meier statistic, log-rank test, p = 0.0734. l Correlations in quantitative immunostaining between p53 and (left) Hsp70 (HSF1 target) or (right) pHSF1 in pancreatic KPC tumors. See also Supplementary Fig. 7i. k, l Scoring used: p53high > 20% of tumor cells stained; p53low < 20% of tumor cells stained. a, c, d, f–j Student’s t test, two-sided. *p ≤ 0.05, **p ≤ 0.01, ***p ≤ 0.001; ns not significant.

