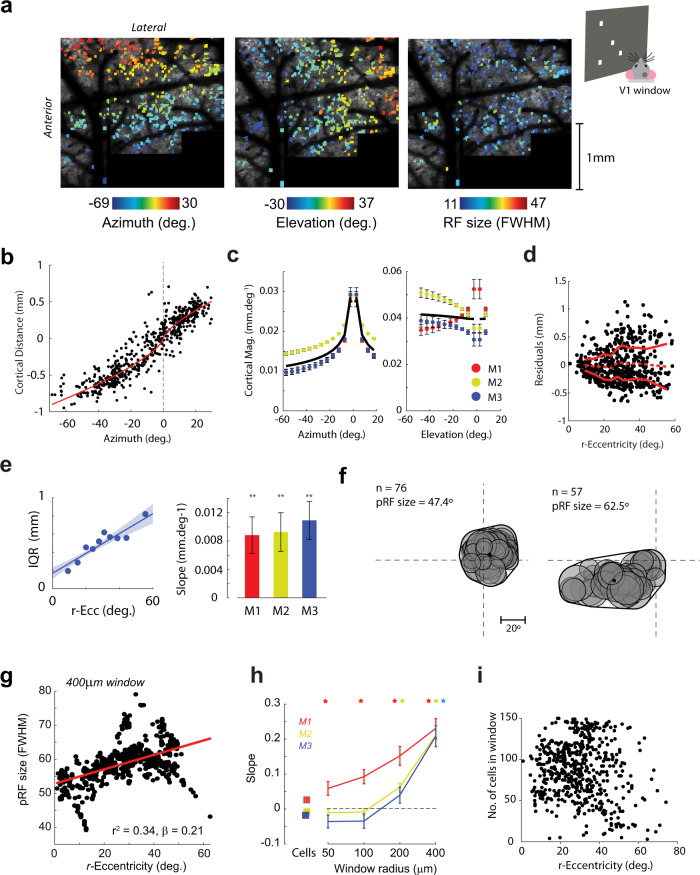
Fig. 4. The region of small pRF size is due to higher cortical magnification and decreased RF scatter.
a Tiled two-photon images from an example mouse covering almost the entirety of V1. The mouse viewed a screen placed at an angle of 30° so that the left visual field could be mapped with sparse noise. Cells for which we could reliably measure the RF (r2 > 0.33, BVI < 1, see Methods) are shown in color according to their preferred azimuth (left), elevation (middle), and RF size (right). The mean image of cortex is shown in the background. b An example relationship between the azimuth of the RF and the distance of the cell body from the foceal representation. The red line shows the fit of an exponential function. The cortical magnification factor (in mm/deg) can be estimated by the slope of this fit. c CMF estimates in the azimuth and elevation directions. The black line is the average across three mice. d RF scatter was estimated by examining the residuals of the RF positions from the exponential fit. The solid red lines indicate the interquartile range of the residuals and the dashed line the mean residual value in 10° sliding windows. r-eccentricity is the spherical angle between the RF center and the focea. e (Left panel) An example linear regression of the interquartile range of the residuals on r-eccentricity. The shaded region shows ± SEM (right panel). The slopes were significantly positive in all three mice (bootstrap test, one-tailed) indicating increased scatter of the residuals with distance from the focea in visual space. **p < 0.01. f Two example pRFs constructed from the single-cell data. For every cell falling within an analysis window (400 µm radius in this example), the Gaussian RF fit was projected into visual space (gray circles). The convex-hull of the resulting region and its area were used to estimate the pRF and its size. n, number of cells contributing to the pRF. g Example linear regression of pRF size on r-eccentricity in M2. h The slope values (β-coefficients) from three mice as a function of window radius. Asterisks, slopes significantly greater than zero (t-test, p < 0.05, two-tailed), error bars indicate 1 SEM. The slopes determined from individual cell RFs (without computation of aggregate RFs) are shown as square symbols. i There was no significant relationship between r-eccentricity and the number of cells in the analysis window (p > 0.05, linear regression, two-tailed).

