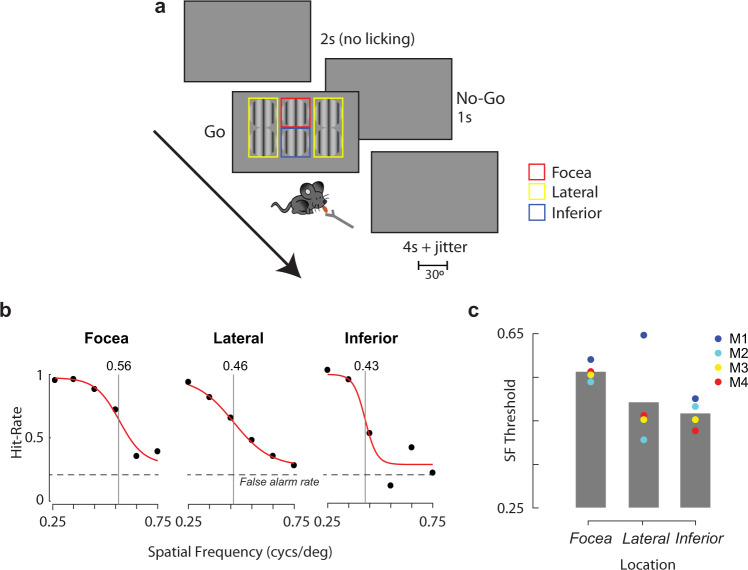
Fig. 7. Visual acuity is higher at the focea.
a Contrast detection task. Mice were trained to lick upon detection of a grating stimulus presented at one of 6 different spatial locations (“go” trials). The locations were grouped into three conditions indicated by the colored squares (not visible to the mouse): focea (red), lateral (yellow), and inferior (blue). On no-go trials no stimulus was presented and mice were trained to refrain from licking. False alarms were punished with timeouts. b Fraction of correct “go” trials for different spatial frequencies of the grating for three different spatial locations for an example mouse. “Focea” indicates stimuli presented in the upper-central visual field at (0° azimuth, 20° elevation), “Lateral” shows responses pooled over the four stimuli at lateral locations (±35° azimuth, −10°/+20° elevation), and “Inferior” for stimuli presented in the lower-central visual field at (0° azimuth, −10° elevation). The vertical line indicates the spatial frequency threshold, estimated by fitting a logistic function. c Spatial frequency thresholds for four mice at the three locations (data from the four lateral locations were similar and is pooled). Spatial frequency thresholds were significantly higher for the focea than the inferior location for all four mice (all p < 0.01, likelihood ratio test, two-tailed).

