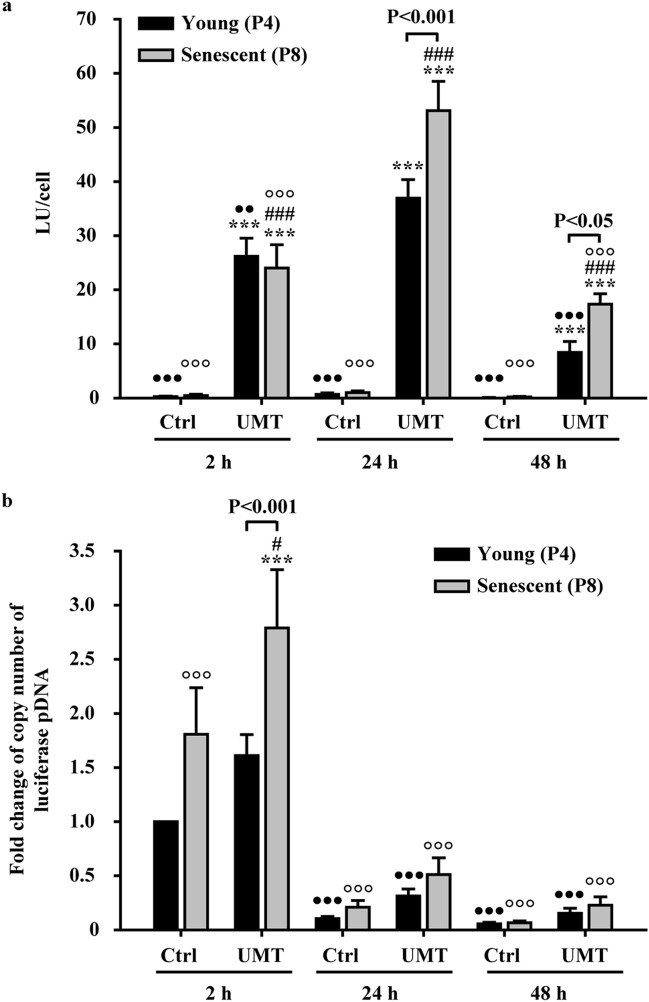
Figure 3.
Comparison of the intracellular luciferase pDNA copy number and luminescence intensity in young and senescent EPCs at 2 h (h), 24 h and 48 h post UMT of luciferase pDNA. (a) The luminescence intensity, indicative of the luciferase protein level, was markedly increased in the UMT groups compared to the corresponding Ctrl groups at the same time points. In addition, in the UMT groups at 24 and 48 h, the senescent cells generated more luminescence than the young cells at the same time points. (b) Quantitative PCR analysis showed a higher luciferase pDNA copy number in the UMT groups than in the corresponding Ctrl groups at the same time points. In addition, the copy number was higher in senescent cells than in young cells at as early as 2 h post UMT. Thereafter, the copy number decreased markedly. See the text for details. n = 7 for each bar. ***P < 0.001 vs. the leftmost black bar at the same time point. #P < 0.05; ###P < 0.001 vs. the leftmost grey bar at the same time point. ••P < 0.01; •••P < 0.001 vs. the highest corresponding black bar and °°°P < 0.001 vs. the highest corresponding grey bar in (a) and (b). Note that for the UMT groups at the same time point, differences between the black and grey bars are indicated. All abbreviations are the same as those used in Fig. 2.

