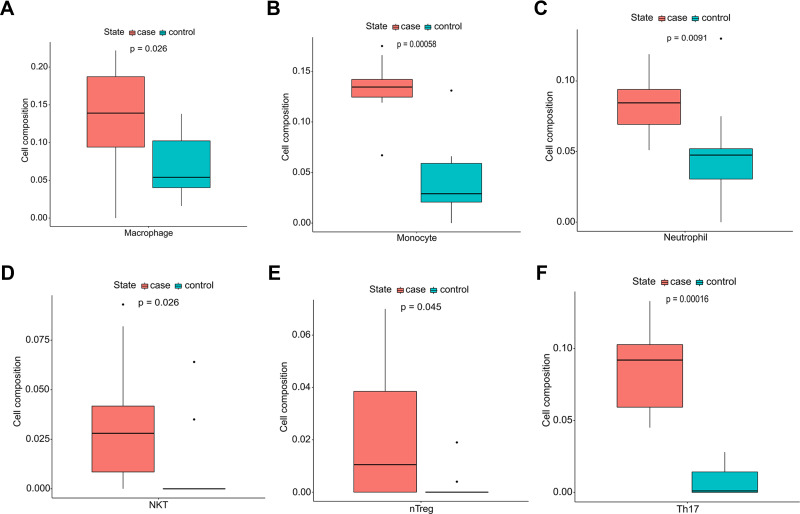
Figure 3.
Immunocyte composition ratio. (A) The composition of macrophages. (B) The composition of monocytes. (C) The composition of neutrophils. (D) The composition of natural killer T cells. (E) The composition of natural regulatory T cells. (F) The composition of T-helper 17 cells. Blue represents the composition of immune cells in normal aortic tissues and red represents the composition of immune cells in TAAD tissues.

