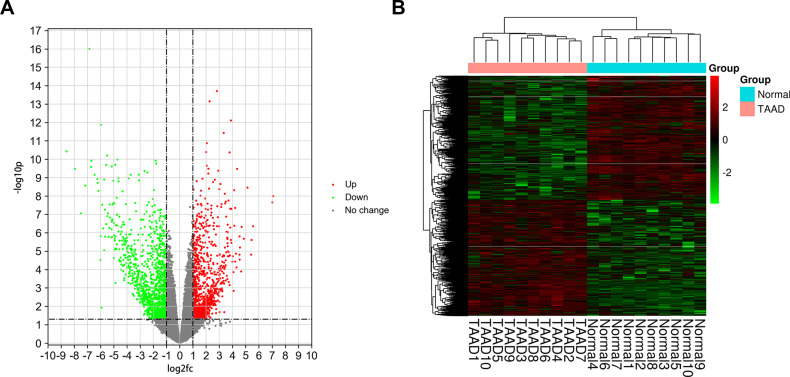
Figure 5.
(A) Volcano chart (B) heatmap of differentially expressed genes (DEGs) in samples. The green dots indicate down-regulated DEGs while the red dots represent up-regulated DEGs in the volcano chart. The relative levels of gene expression are represented using a color scale: red represents high levels while blue represents low levels.

