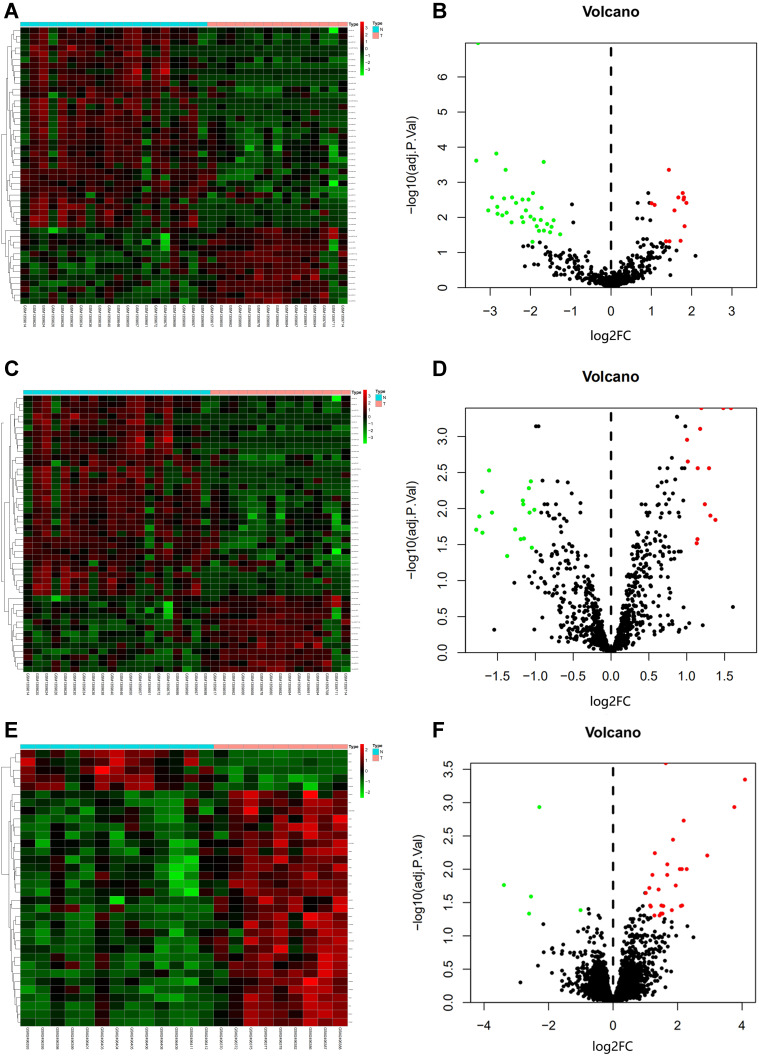
Figure 1.
Volcano plot and heat map of GSE56350, GSE70754, and GSE95109. (A) Unsupervised clustering analysis of differentially expressed (DE) miRNAs in GSE56350. Red dots indicate significantly up-regulated miRNAs, green dots indicate significantly down-regulated miRNAs. (B) Volcano plots of miRNAs in GSE56350. Red dots indicate up-regulated DEmiRNAs, green dots indicate down-regulated DEmiRNAs, black dots indicate non-differentially expressed miRNAs. (C) Unsupervised clustering analysis of DE miRNAs in GSE70754. Red dots indicate significantly up-regulated miRNAs, green dots indicate significantly down-regulated miRNAs. (D) Volcano plots of miRNAs in GSE70754. Red dots indicate up-regulated DEmiRNAs, green dots indicate down-regulated DEmiRNAs, black dots indicate non-differentially expressed miRNAs. (E) Unsupervised clustering analysis of the DE miRNAs in GSE95109. Red dots indicate significantly up-regulated miRNAs, green dots indicate significantly down-regulated miRNAs. (F) Volcano plots of miRNAs in GSE95109. Red dots indicate up-regulated DEmiRNAs, green dots indicate down-regulated DEmiRNAs, black dots indicate non-differentially expressed miRNAs.

