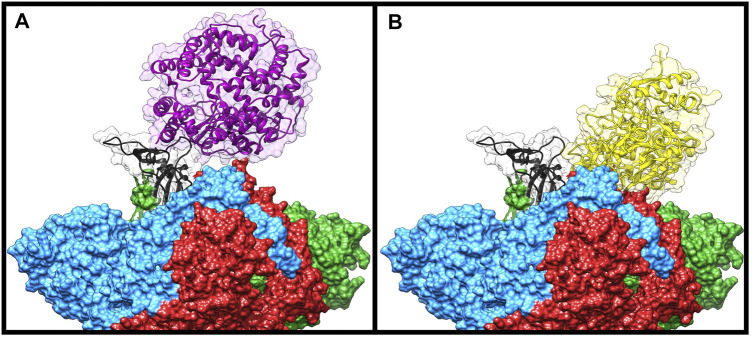
FIGURE 4.
Comparison of the Frodock best complex and ACE2-spike glycoprotein (PDB ID: 6LZG). The red, blue, and green solid surfaces represent the three different chains composing the spike glycoprotein. The black ribbons highlight the CTD1 domain in the up conformation. The magenta and yellow ribbons represent the ACE2 (A) and the bovine lactoferrin (B), respectively, surrounded by a transparent molecular surface representation, in order to point out the positions occupied in the space by the different structures.

