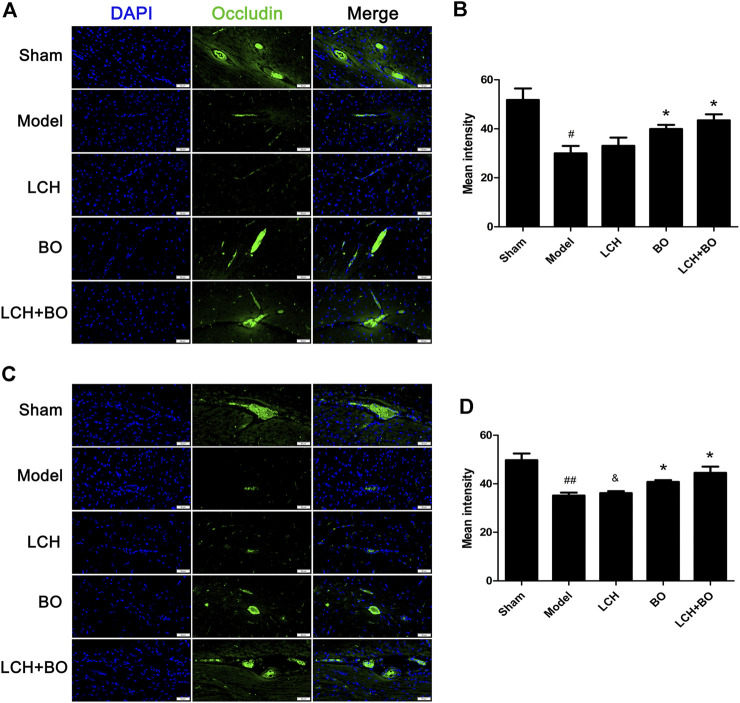
FIGURE 12.
Expressions of occludin within DG and SVZ of MCAO rats. (A) Representative immunostaining images of occludin in the DG area. (B) The results of average fluorescence intensities of occludin in the DG area (n = 3). (C) Representative immunostaining images of occludin in the SVZ area. (D) The results of average fluorescence intensities of occludin in the SVZ area (n = 3). # p < 0.05, ## p < 0.01 compared to the sham group; * p < 0.05 compared to the model group; & p < 0.05 compared to the LCH + BO group.

