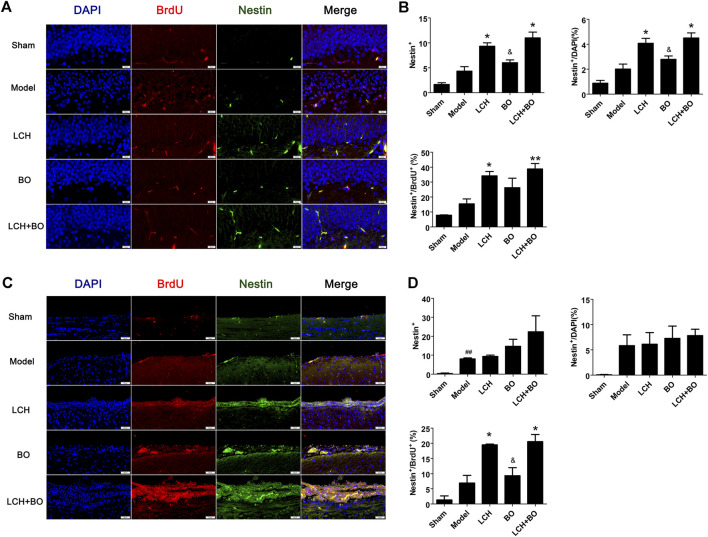
FIGURE 3.
NSC proliferation within DG and SVZ of MCAO rats. (A) Representative double-immunostaining images of Nestin+/BrdU+ in the DG area. (B) The results of Nestin+ cells, Nestin+/DAPI, and Nestin+/BrdU+ in the DG area (n = 3). (C) Representative double-immunostaining images of Nestin+/BrdU+ in the SVZ area. (D) The results of Nestin+ cells, Nestin+/DAPI, and Nestin+/BrdU+ in the SVZ area (n = 3). ## p < 0.01 compared to the sham group; * p < 0.05, ** p < 0.01 compared to the model group; & p < 0.05 compared to the LCH + BO group.

