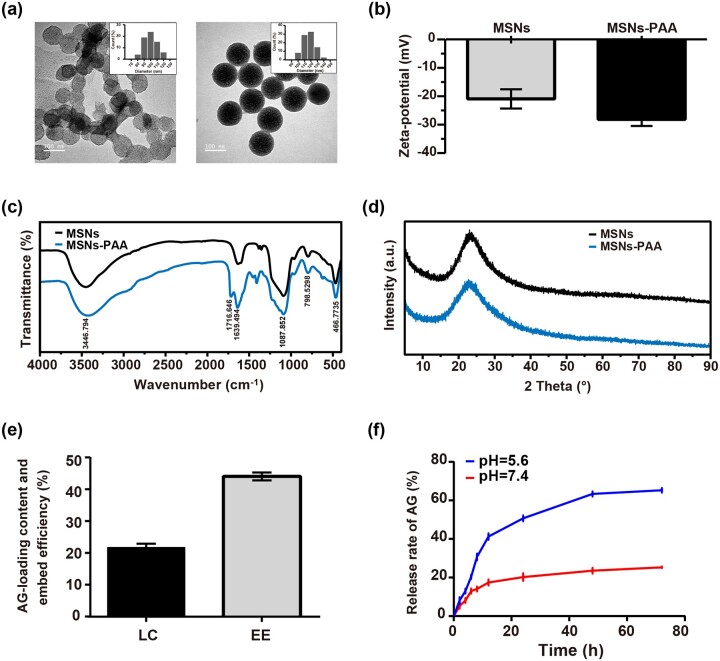
Figure 1.
Characterization of nanoparticles. (a) TEM images and size distribution (insets) of MSNs and MSNs-PAA (scale bar: 100 nm). (b) Zeta potential, (c) FT-IR spectra, and (d) XRD spectra of MSNs and MSNs-PAA. (e) Drug loading capacity and encapsulation efficiency of MSNs-PAA. (f) Cumulative drug release curve of AG@MSNs-PAA at pH 5.6 or 7.4 in vitro. Data were shown as mean ± SD (n = 3).

