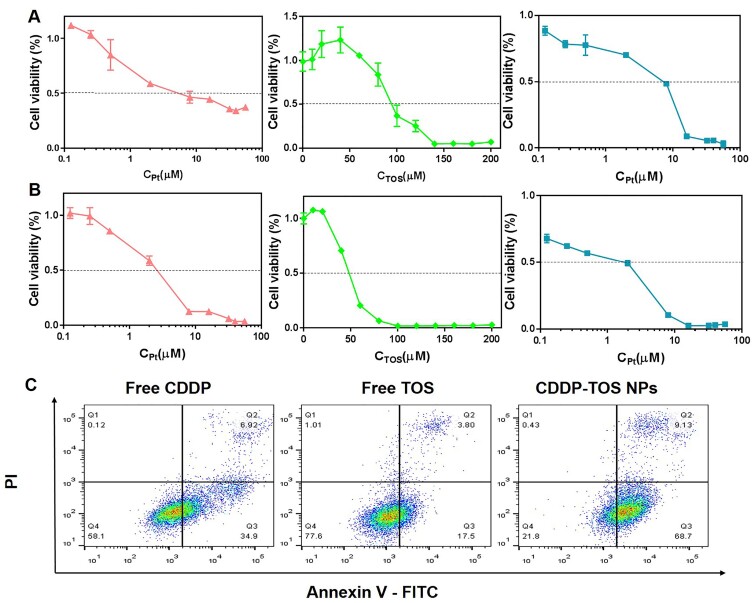
Figure 7.
The cell viability of A549 cells upon treatment with free CDDP (red), free TOS (green) and CDDP-TOS NPs (blue) for 24 h (A) or 48 h (B).
All data are expressed as mean±SD (n=5). (C) FCM patterns of A549 cells after different treatments for quantifying cell apoptosis. All data are expressed as mean±SD (n=3).

