Figure 1.
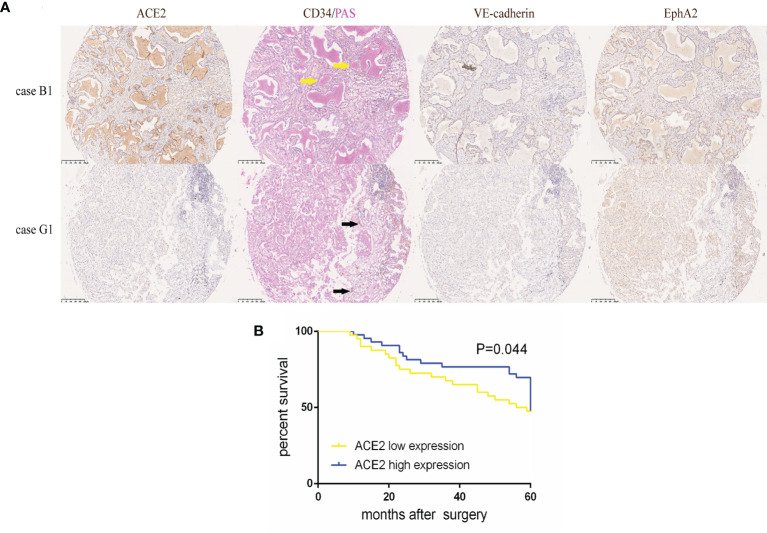
High ACE2 expression was linked to increased VM and better prognosis in NSCLC. (A) Typical image of ACE2, VE-cadherin, EphA2 protein expression and CD34/PAS double staining in TMA tissues. Case B1 had massive CD34−/PAS+ VM (yellow arrows) lined by ACE2, VE-cadherin and EphA2 high expressing tumor cells. Case G1 had abundant CD34+/PAS− MVs (black arrows) with ACE2, VE-cadherin and EphA2 low expressing tumor cells. (B) Kaplan-Meier analysis of OS in NSCLC patients with ACE2 low or high expression. P = 0.044.

