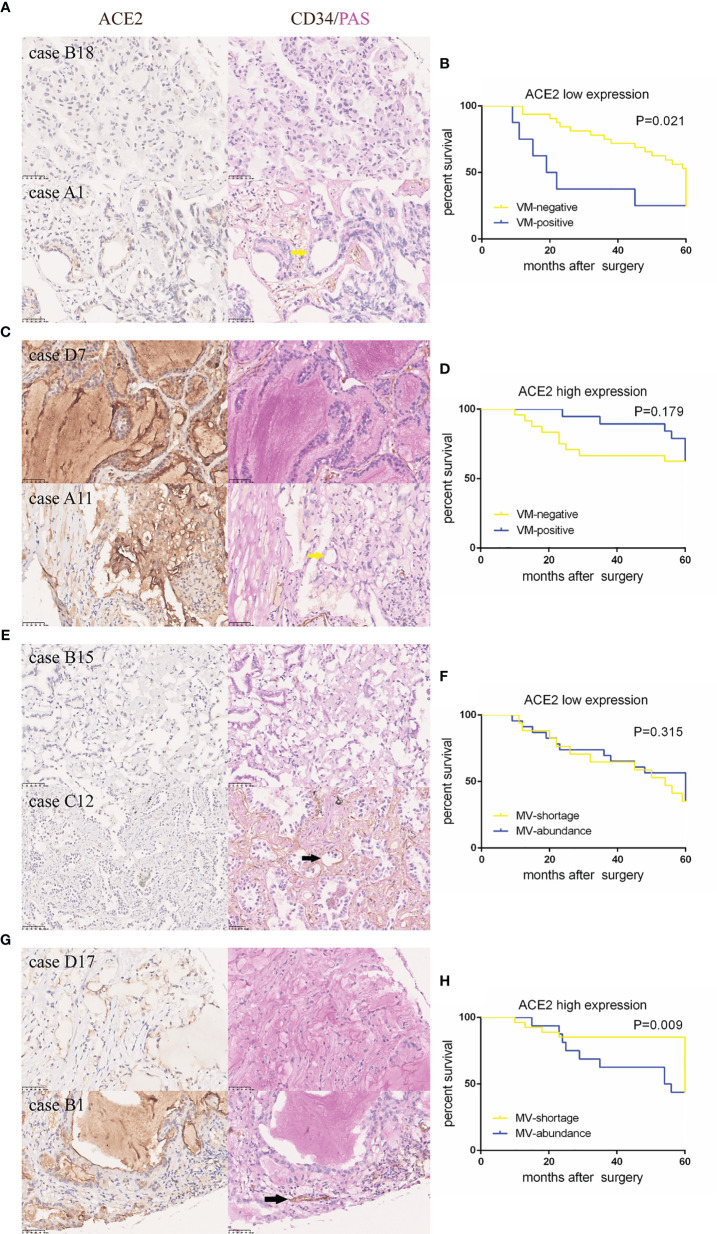
Figure 2.
ACE2-induced better outcome in NSCLC patients might be attributed to less vessels and more VM formation. (A, C, E, G) Typical tissue images of each group stained with ACE2 or CD34/PAS. Yellow arrows: CD34−/PAS+ VMs; black arrows: CD34+/PAS− MV. (B, D, F, H) Kaplan–Meier analysis of OS in each group.

