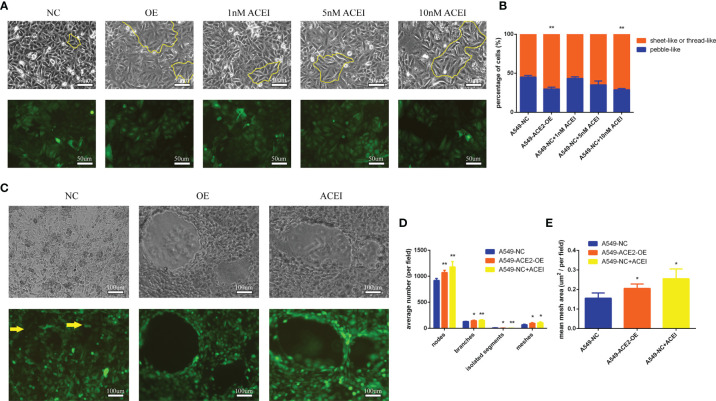
Figure 4.
Tube formation ability of A549 cells was improved with ACE inhibitory state. (A) Morphologies of a panel of A549-ACE2-OE cells, A549-NC cells, and A549-NC cells treated with ACEI (1, 5, and 10 nM/L) were shown as sheet-like and thread-like cell types in 2D culture, which were outlined partly with yellow lines. Representative images were shown above. Upper: white light; lower: fluorescence. (B) Quantification of sheet-like or thread-like cells and pebble-like cells in three groups, representatively, Mean ± SD, n = 3, **p < 0.01. (C) Images of both above cell lines grown in 3D Matrix gel. A 10 nM/L ACEI dilution was performed. Representative images were shown above. Yellow arrows point out the free cancer cells escaping from tube wall and isolated segments. Upper: white light; lower: fluorescence. (D, E) Images of 3D culture were applied to determine average number of nodes, branches, isolated segments, meshes and mean mesh area in those groups, per field, Mean ± SD, n = 3, **p < 0.01, *p < 0.05. ns, no significance.

