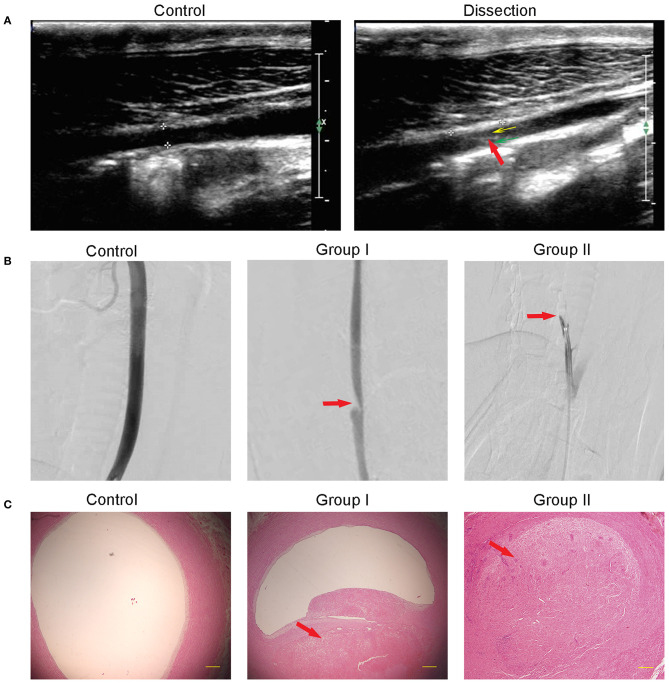
Figure 2.
Morphological changes after dissection. (A) Ultrasound showed a normal artery in the control and the false lumen (yellow arrow), true lumen (green arrow), and dissociated intima (red arrow) in the dissection. (B) DSA showed that the intramural hematoma formation caused arterial lumen stenosis (Group I) or occlusion (Group II). The red arrow points to the dissection location. (C) H&E staining showed that the subintima hematoma, which is partly organized, caused stenosis in Group I or full occlusion in Group II. Contralateral arterial lumen showed no stenosis or occlusion.

