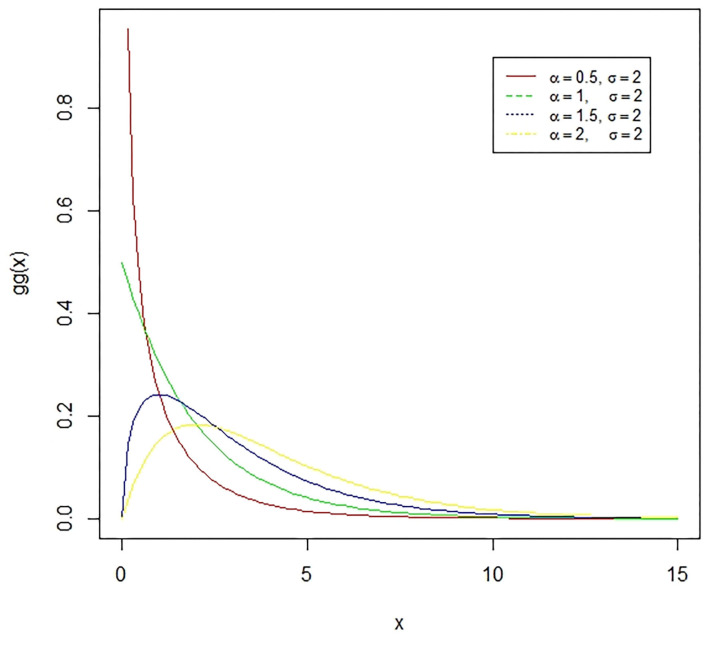
Figure 5.
The Gamma distribution is the distribution of a random variable X for which E(X) = κθ = is fixed and greater than zero, and E[log(X)=ψ(κ) + log(κ) = log(α) − log(σ) is fixed (ψ is the digamma function). The presented figure represents different gamma curves for different values of the parameters α and σ.

