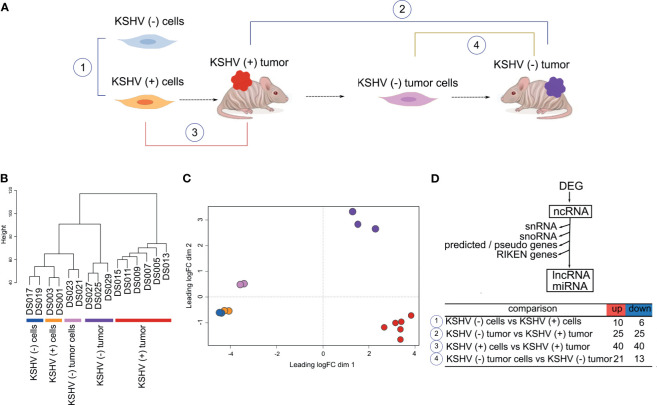
Figure 1.
Genome-wide analysis of Non-coding RNAs in a cell and animal model of Kaposi’s Sarcoma. (A) Schematic representation of the mouse-KS cell and tumor model. (B) Unsupervised clustering of the host ncRNA transcriptome. (C) Multidimensional scaling plot of the host ncRNAs showing the distance of each sample from each other determined by their leading log Fold Change (FC). (D) Workflow analysis and number of DE lncRNAs in key biological comparisons that were detected by RNA-sequencing analysis of: two KSHV (+) cells, two KSHV (−) cells, six KSHV (+) tumors, two KSHV (−) tumor cells and three KSHV (−) tumors.

