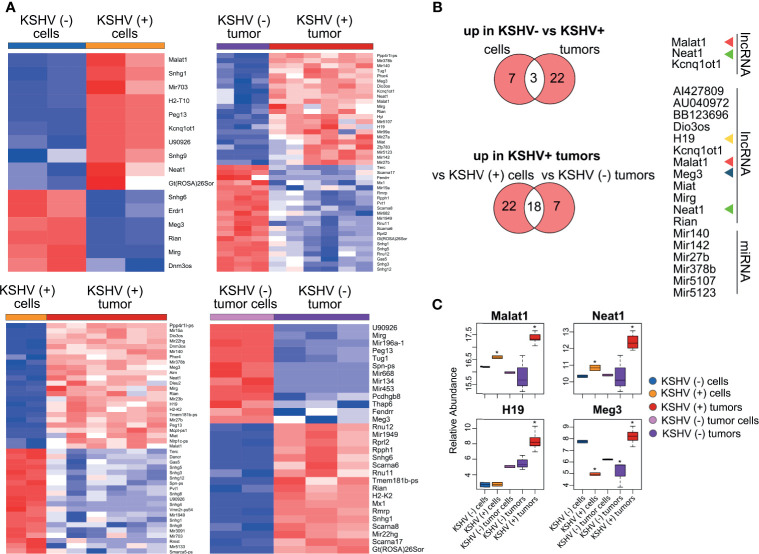
Figure 2.
Host lncRNAs expression. (A) Heat maps for fold change expression of host lncRNAs based on analysis of RNA sequencing data, all or the top 25 upregulated (red) and top 25 downregulated (blue) DE lncRNAs are shown in each comparison. (B) Venn diagrams showing upregulated host lncRNAs common in KSHV (+) cells and tumors versus KSHV (−) cells and tumors (top), and upregulated host lncRNAs common in KSHV (+) tumors versus KSHV (+) cells and KSHV (+) tumors versus KSHV (−) tumors (bottom). (C) Relative abundance of selected lncRNA RNAs across the different steps of the mouse-KS cell and tumor model. The asterisk refers to the level of statistical significance, established at p value <0.01.

