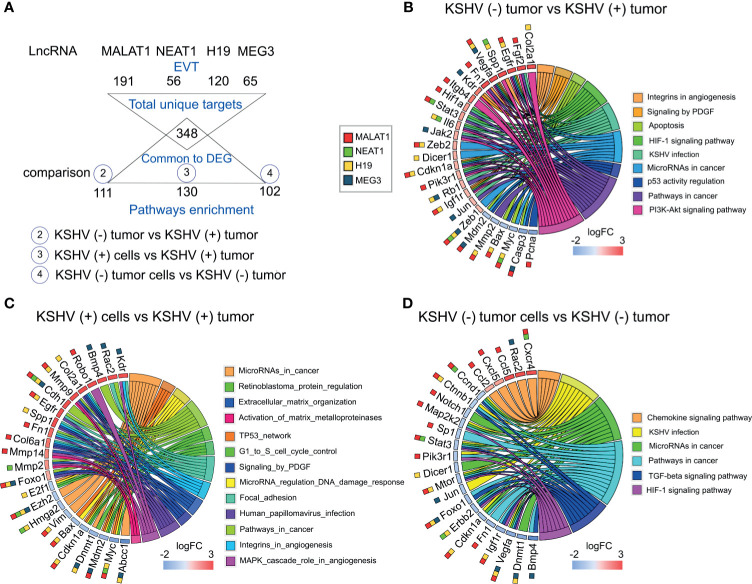
Figure 3.
Pathway analysis of selected DE lncRNAs and their EVT genes. (A) Schematic representation of the EVT genes of Malat1, Neat1, H19 and Meg3 that were correlated with gene expression in the RNA-sequencing analysis. (B–D) Chord plot illustrating the GO biological process terms and the target genes contributing to that enrichment arranged in order of their expression level in KSHV (−) tumors versus KSHV (+) tumors (B), KSHV (+) cells versus KSHV (+) tumors (C) and KSHV (−) tumor cells versus KSHV (−) tumors (D). The corresponding lncRNAs are indicated with color boxes besides each target gene.

