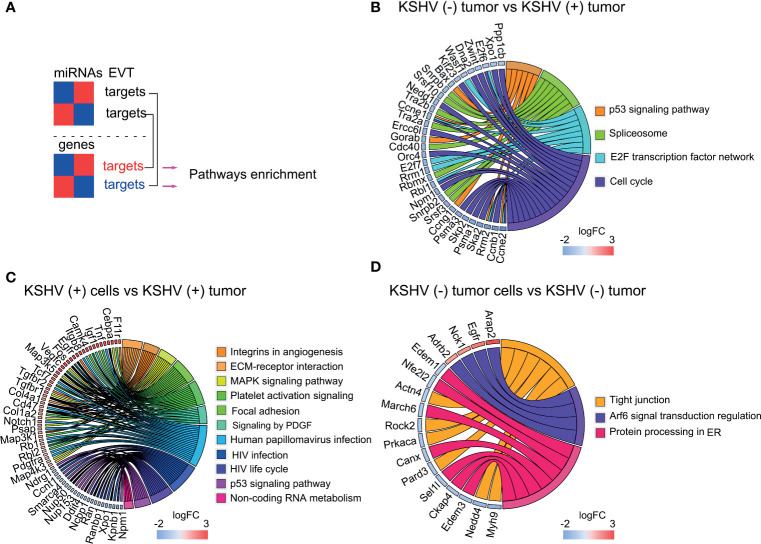
Figure 5.
Pathway analysis of DE miRNAs and their experimentally validated target (EVT) genes. (A) Schematic representation of the miRNA–mRNA pairs with significant (p < 0.05) antagonistic expression. (B–D) Chord plot illustrating the GO biological process terms and the target genes contributing to that enrichment arranged in order of their expression level in KSHV (−) tumors versus KSHV (+) tumors (B), KSHV (+) cells versus KSHV (+) tumors; for a better visualization only a fraction of the genes corresponding to the plot is shown. The full list is available in Supplementary Table 5 (C) and KSHV (−) tumor cells versus KSHV (−) tumors (D).

