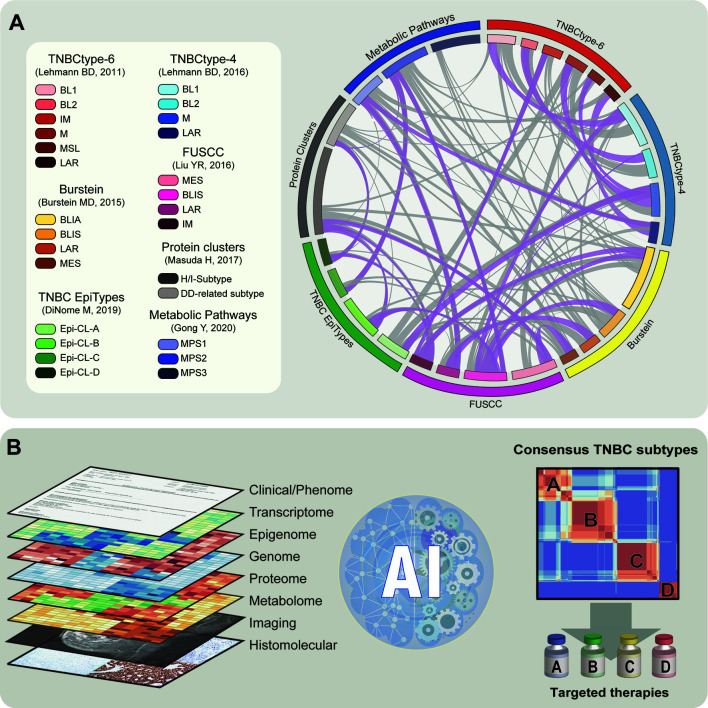
Figure 1.
Illustrative representation of current subtypes and the future of subsetting in TNBC. (A) Left panel: Summary of TNBC classification methods described and their subtypes. Right panel: Representation of the similitude between the different classification systems that reported comparisons with existing methods. Ribbons represent the partial overlap between different subtypes. Ribbons referring to strong overlaps are shown in purple. (B) Left panel: Schematic representation of the different layers of information to construct the definitive TNBC subtypes. This includes clinical, molecular, and histological data. Middle plot: Representation of application of artificial intelligence (AI) algorithm to integrate diverse datasets and construct TNBC subtypes. Right panel: Schematic correlation plot representing consensus integrative TNBC subtypes. TNBC stratification can be applied to improve subtype-specific therapies.

