
Table 1.
KEGG pathway enrichment analysis based on the genes being differentially expressed with age
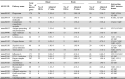 |
Note: KEGG pathways that were significantly regulated in at least three of the investigated tissues were shown. P values were calculated based on a hypergeometrical approach used by DAVID 6.8 and adjusted using the Benjamini–Hochberg FDR approach [8]. The first two pathways are potential marker pathways for aging. No overlap was found with any enriched pathway in skin tissue.