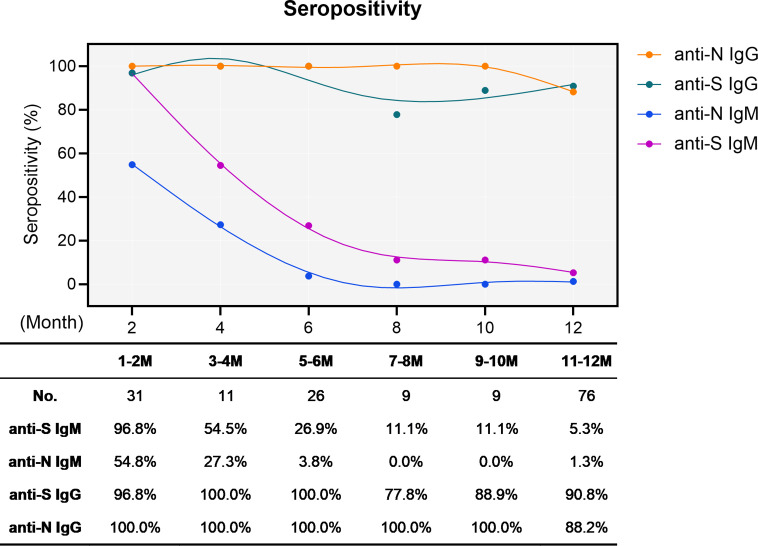
Figure 1.
Sero-positivity of virus-specific IgG and IgM antibodies in 76 convalescent COVID-19 patients over time. The x-axis indicates the timeline following the onset of symptoms. Curves show the overall sero-positivity of IgG and IgM antibodies recognizing the RBD of the spike protein (anti-S IgG: green; anti-S IgM: purple) and the nucleoprotein (anti-N IgG: orange; anti-N IgM: blue). Numbers of samples (No.) at different time points are depicted under the diagram.

