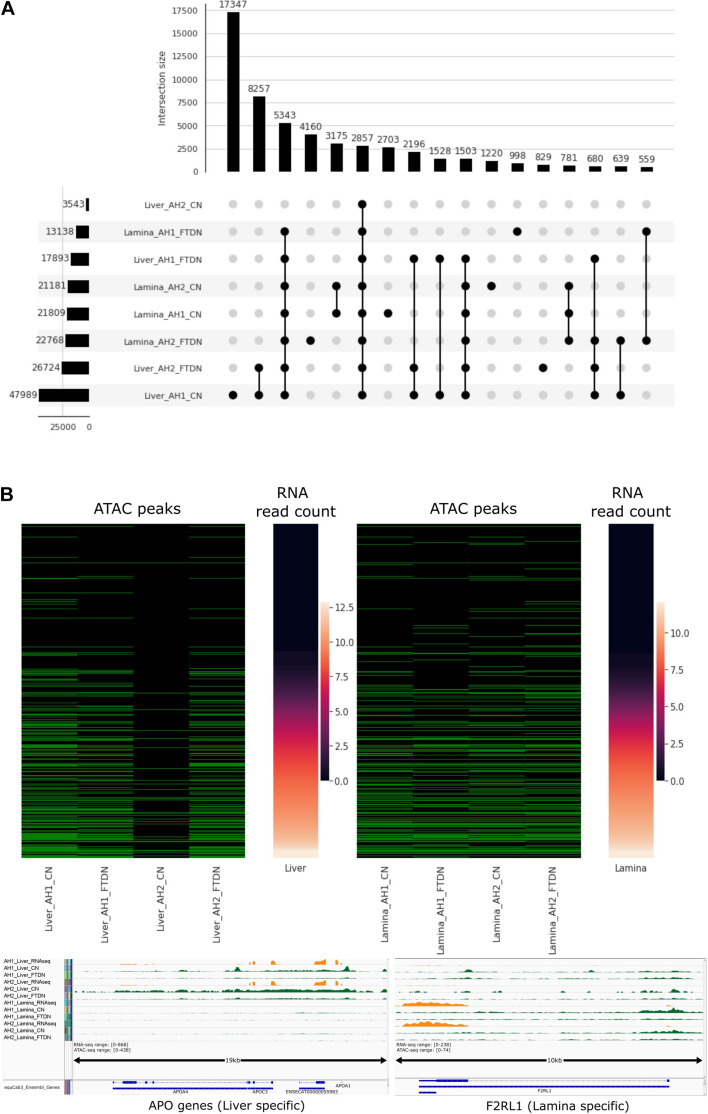
FIGURE 4.
Filtered ATAC-seq peaks. (A) Intersection plot of quality filtered peaks from each library. Bottom left panel shows filtered peak count in each library; bottom right panel shows different intersections (BedTools, 1 bp minimum) of peaks where filled dots indicate presence of peaks in corresponding library; Top panel shows peak count in each intersection. (B) Relationship between promoter accessibility and gene expression (mean vst transformed count) in liver (top left) and lamina (top right). Green cell in ATAC peaks indicate presence of ATAC peaks and black cells indicate absence. Bottom panel shows bigwig tracks of RNA-seq and ATAC-seq read abundance (normalized using RPKM)near APO genes (left, liver specific) and F2RL1 (right, lamina specific) transcription start sites.

