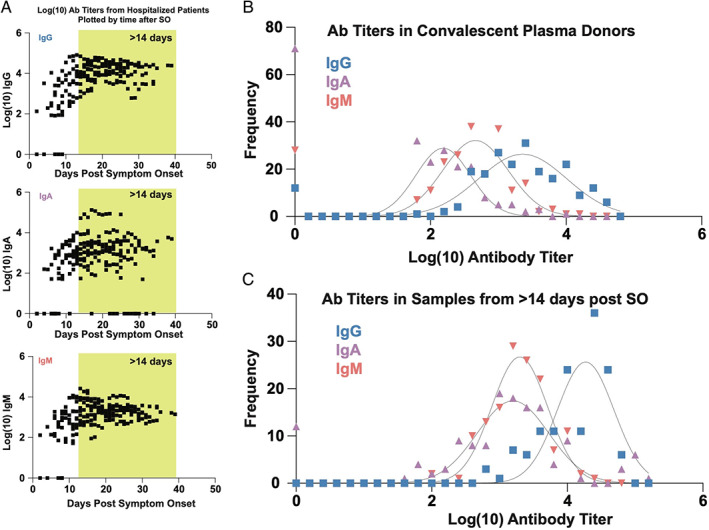
FIGURE 3.

Population level longitudinal analysis of SAR‐CoV‐2 receptor‐binding domain antibodies in hospitalized patients over time. (A) Logarithmic endpoint titers from 201 samples collected from hospitalized PCR‐confirmed COVID‐19 patients are plotted over time after symptom onset. (B, C) Frequency distribution (histogram) analysis of class‐specific SARS‐CoV‐2 endpoint titers in 220 convalescent plasma units (B) and 172 longitudinal samples collected >14 days after symptom onset (shaded yellow in Figure 2(A))
