FIGURE 9.

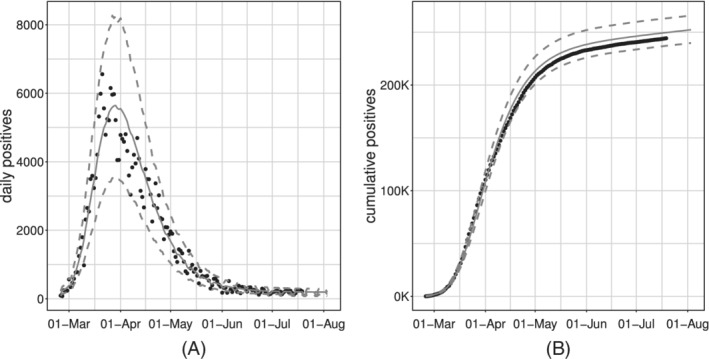
Observed (black dots) and fitted values (gray solid lines) with 95% confidence intervals (gray dashed lines) for the model with baseline and week‐day additive effect, estimated on the daily positives

Observed (black dots) and fitted values (gray solid lines) with 95% confidence intervals (gray dashed lines) for the model with baseline and week‐day additive effect, estimated on the daily positives