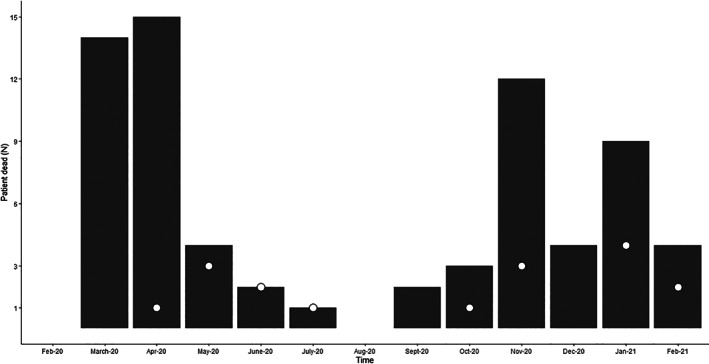
FIGURE 1.

Bars display the number of patients who died during the study period, and the dots represent the number of video calls performed at end of life. Time denotes month‐year

Bars display the number of patients who died during the study period, and the dots represent the number of video calls performed at end of life. Time denotes month‐year