
Figure 2.
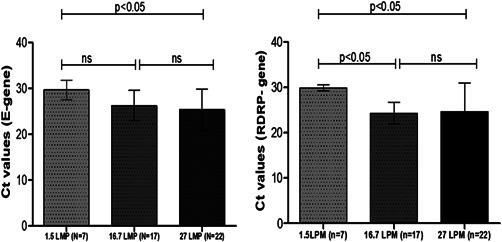
Bar diagram showing mean and standard deviation (SD) of cycle threshold (C t) values of RT‐PCR test for E‐gene and RdRp gene of SARS‐CoV‐2 virus conducted with particulate matter obtained from air of different wards admitting COVID‐19 patients when the flow rate of air sampler was adjusted to 1.5, 16.7, and 27 liter per minute (LPM). Mean and SD were calculated from the samples those were positive for both E‐gene and RdRp gene irrespective of distance from the patient at which the air sampler was placed. COVID‐19, coronavirus disease 2019; RT‐PCR, reverse‐transcriptase polymerase chain reaction; SARS‐CoV‐2, severe acute respiratory syndrome coronavirus 2