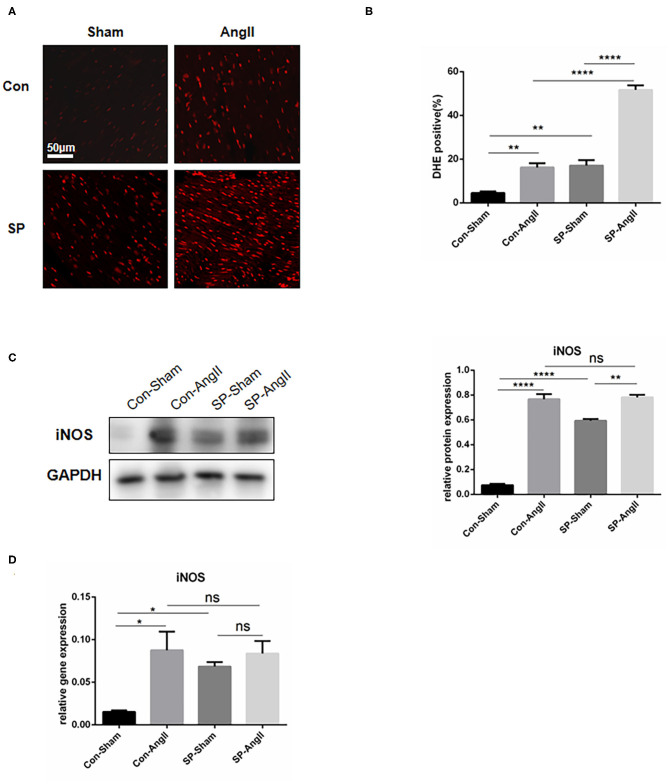
Figure 3.
Cardiac fibroblast-specific PGC-1αKO activates the oxidative stress response in the heart. (A) Representative cross sections of the heart stained for DHE. (B) Quantitative analysis of reactive oxidative stress as assessed by DHE staining. (C) Representative Western blot and analysis of the expression of iNOS. (D) qPCR analysis of the mRNA expression levels of iNOS. N.S. indicates no significant difference. *p < 0.05, **p < 0.01. Data represent mean ± SEM (n = 3–5 per group).

