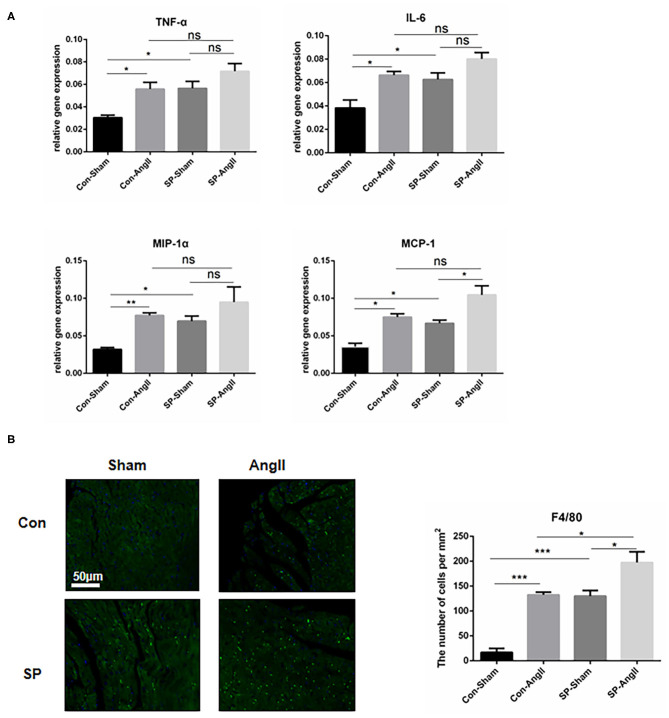
Figure 4.
Cardiac fibroblast-specific PGC-1αKO aggravates the inflammatory response in the heart. (A) qPCR analysis of the mRNA expression levels of inflammatory genes (TNF-α, IL-6, MCP-1, MIP-1α). N.S. indicates no significant difference. (B) Representative cross sections of the heart stained for F4/80 and quantitative analysis of the number of positive cells. *p < 0.05, **p < 0.01, ***p < 0.001. Data represent mean ± SEM (n = 5 per group).

