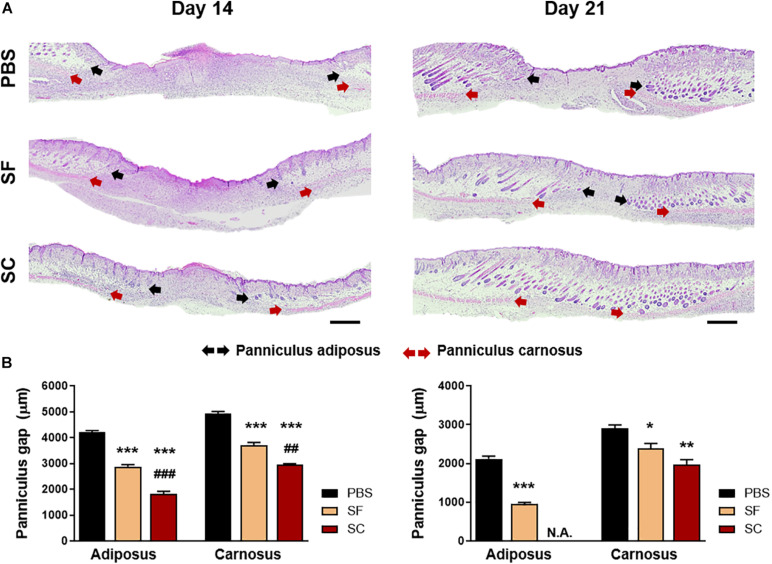
FIGURE 4.
Hematoxylin and eosin (H&E) staining of the wound on days 14 and 21. (A) Light microscopy images of the wound bed representing the panniculus adiposus (black arrow) and carnosus (red arrow) (Scale bar = 500 μm). (B) Quantitative measurement of the panniculus gap at days 14 and 21 (*compared with the PBS group; #compared with the SF group; *p < 0.05; **##p < 0.01; ***###p < 0.001).

