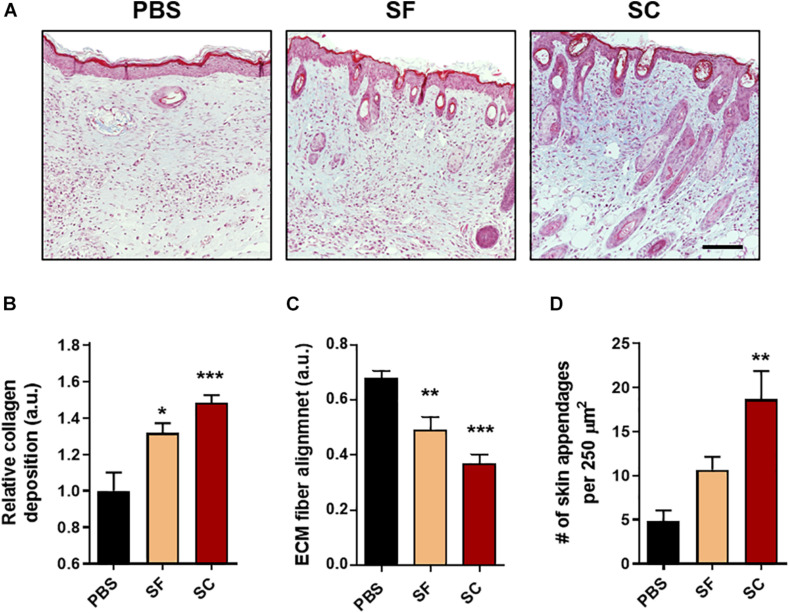
FIGURE 5.
Masson’s trichrome (MTC) staining of the wounds at day 21. (A) Representative light microscopy images (Scale bar = 100 μm). The qualitative analysis of the skin regeneration (B) collagen deposition, (C) extracellular matrix (ECM) fiber alignment, and (D) the number of skin appendages (*compared with the PBS group; #compared with the SF group; ∗p < 0.05; **p < 0.01; ***p < 0.001).

