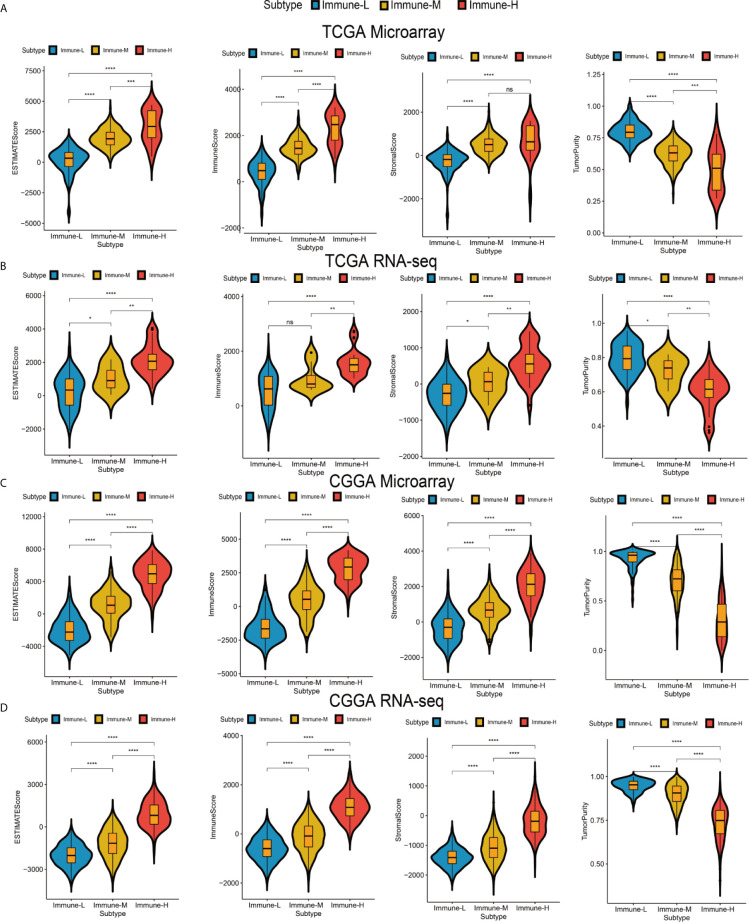
Figure 2.
Differences among immune phenotypes in terms of four glioma immune microenvironment signatures. (A–D) Violin plots comparing the ESTIMATE, immune and stromal scores and tumor purity among immune phenotypes in the TCGA microarray, TCGA GBM RNA-seq, CGGA microarray, and CGGA RNA-seq cohorts respectively. P values for Wilcoxon test were shown on the top of each violin plot. *P < 0.05; **P < 0.01; ***P < 0.001; ****P < 0.0001. ns, not significant.

