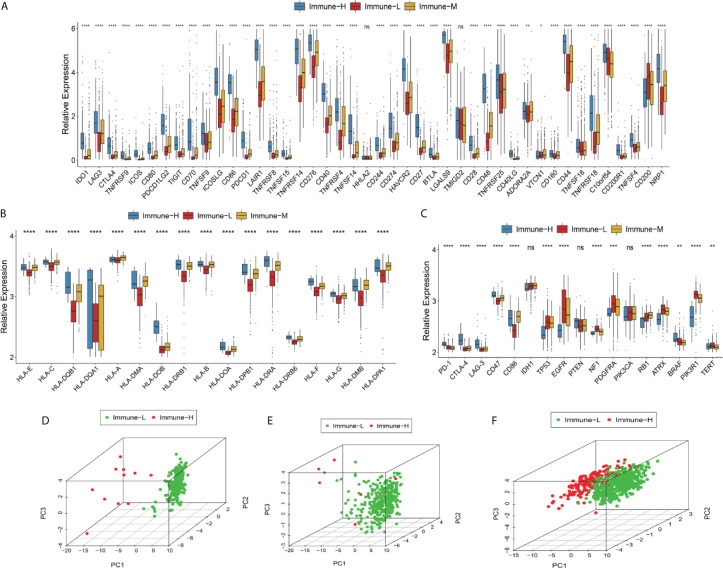
Figure 3.
Differences in checkpoints, HLA family and other key biomarkers between the immune phenotypes. (A) Expression of checkpoint family biomarkers of each phenotype in the CGGA RNA-seq cohort. (B) Expression of HLA family genes of each phenotype in the TCGA microarray cohort. (C) Expression of part T cells co-inhibitors checkpoints and key biomarkers relating to glioma biological behavior and pathways in the TCGA microarray cohort. The upper and lower ends of the boxes represented interquartile range of values. The lines in the boxes represented median value, and black dots showed outliers. The asterisks represented the statistical P value (*P < 0.05; **P < 0.01; ***P < 0.001; ***P < 0.0001, ns, not significant). (D–F) There was separation between the immune-H and immune-L phenotypes in the TCGA microarray (D), TCGA GBM RNA-seq (E) and CGGA RNA-seq cohorts (F) according to PCA. PC1, PC2, PC3 represented three dimensions showing differential expression of markers related to immune cell lineage.

