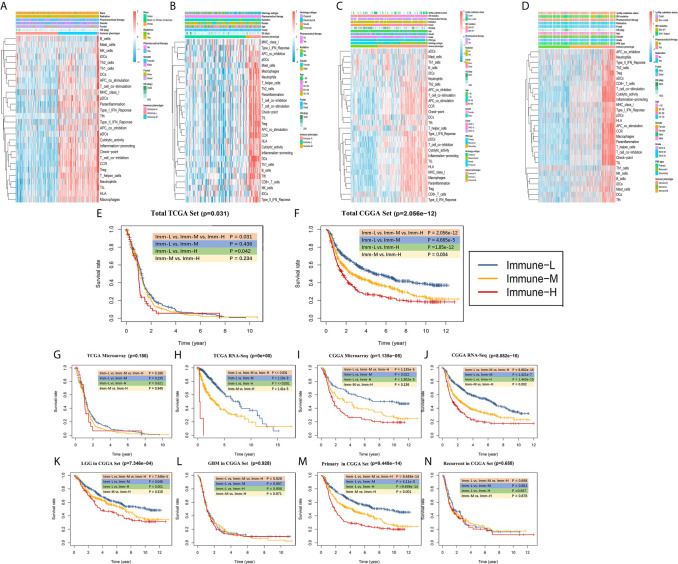
Figure 4.
Survival data showing that the immune-H phenotype is associated with a poor prognosis. (A–D) Complex heatmaps including ssGSEA results and clinical information from involved TCGA microarray, TCGA GBM RNA-seq, CGGA microarray, and CGGA RNA-seq cohorts. (E, F) Survival plots showed immune-H phenotype had poorer survival in all three immune phenotypes in total TCGA (P = 0.031) and CGGA (P = 2.056e-12) datasets. (G–J) Survival plots showing prognosis discrepancies among three immune phenotypes in TCGA microarray, TCGA RNA-Seq, CGGA microarray, CGGA RNA-Seq cohorts. (K–N) Survival plots for the LGG, GBM, primary glioma and recurrent glioma subpopulations in the total CGGA dataset. The log-rank test P value among three phenotypes and every two phenotypes are marked and shown.

