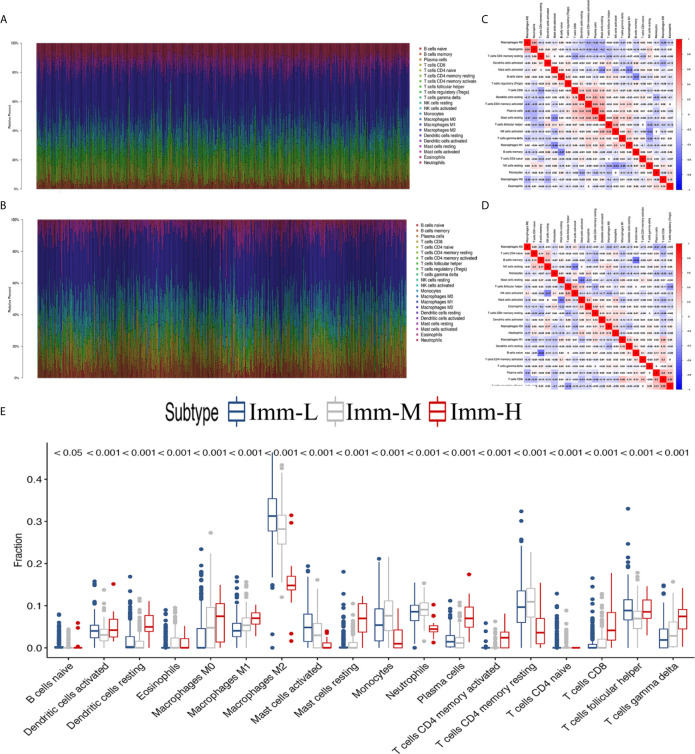
Figure 5.
The landscape of immune cell infiltration in the glioma microenvironment. (A, B) The proportions of 22 infiltrating immune cells in the glioma microenvironment in the TCGA microarray and CGGA RNA-seq cohorts respectively. (C, D) Correlation heatmaps of the TCGA microarray and CGGA RNA-seq cohorts respectively. (E) Immune cell infiltration level of glioma microenvironment among immune phenotypes in the TCGA microarray cohort based on the CIBERSORT algorithm.

