Figure 6.
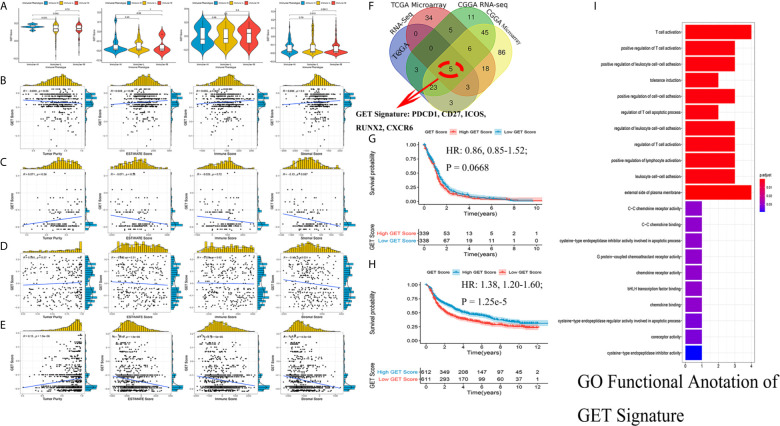
Detection of a gene expression signature of exhausted CD8+ T cells in glioma. (A) Comparisons of GET Score among classified immune phenotypes in TCGA microarray, TCGA RNA-Seq, CGGA microarray, CGGA RNA-Seq four cohorts. (B–E) The correlation between GET Score and Tumor Purity, ESTIMATE Score, Immune Score and Stromal Score in above four cohorts respectively. (F) Venn diagram exhibited the five selected genes termed as GET Signature (PDCD1, CD27, ICOS, RUNX2, CXCR6). (G, H) Comparison of the prognosis of high GET Score and low GET Score group in total TCGA and CGGA datasets. The cut-off value was defined as the median GET Score of all involved samples. (I) Functional enrichment of GO terms relating to the GET Signature.

