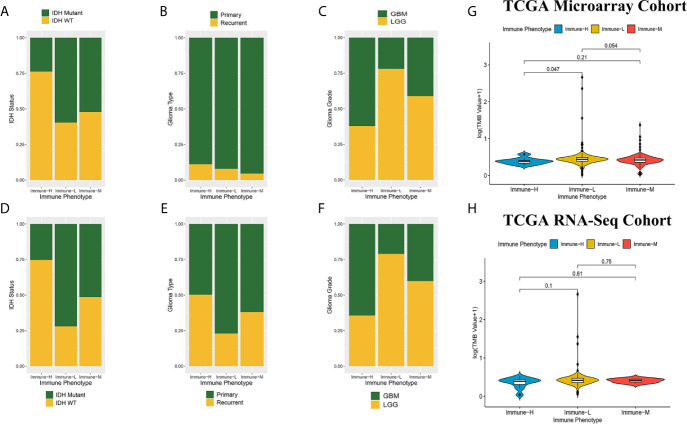
Figure 8.
Comparison on IDH status, glioma type, grade and tumor mutation burden among immune phenotypes. (A) Proportion of IDH-mutant and IDH-wild type glioma in three phenotypes in CGGA microarray cohort. (B) Proportion of primary and recurrent glioma in three phenotypes in CGGA microarray cohort. (C) Proportion of LGG and GBM in three phenotypes in CGGA microarray cohort. (D) Proportion of IDH-mutant and IDH-wild type glioma in three phenotypes in CGGA RNA-seq cohort. (E) Proportion of primary and recurrent glioma in three phenotypes in CGGA RNA-seq cohort. (F) Proportion of LGG and GBM in three phenotypes in CGGA RNA-seq cohort. (G) Violin plot showing comparison of TMB based on immune-phenotypes in TCGA microarray cohort. (H) Violin plot showing comparison of TMB based on immune-phenotypes in TCGA RNA-seq cohort. LGG, low grade glioma; GBM, glioblastoma.

