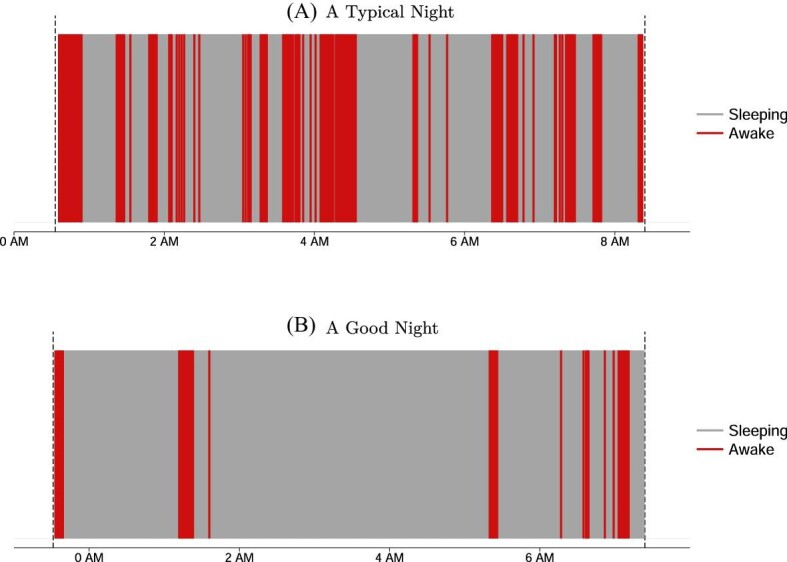
Figure I.

Typical Sleep in Chennai
This figure represents actigraph-measured sleep-wake patterns of two particular nights of two selected study participants. Light gray areas indicate one-minute periods in which the participant was asleep, and dark red areas (color version available online) indicate periods in which the participant was awake according to the actigraph. The gray dashed lines indicate when the participant got into or out of bed. In Panel A we show a typical night in our sample, represented by average levels of time in bed, time asleep, and sleep efficiency. During this particular night, the participant stayed in bed for 7 hours, 45 minutes but slept for only 5 hours, 20 minutes, resulting in a sleep efficiency of 69%, corresponding to the 41st, 40th, and 43rd percentile of the control group, respectively. The participant awoke 31 times during this night, and the longest sleep episode lasted 45 minutes. Panel B depicts a good night of sleep, with sleep patterns similar to those found in the United States and other rich countries: the participant stayed in bed for 7 hours, 53 minutes and slept for 7 hours, 8 minutes, resulting in a sleep efficiency of 90%, corresponding to the 46th, 91st, and 99th percentile of the control group, respectively. In this night, the participant only awoke nine times, and the longest sleep episode lasted 223 minutes.
