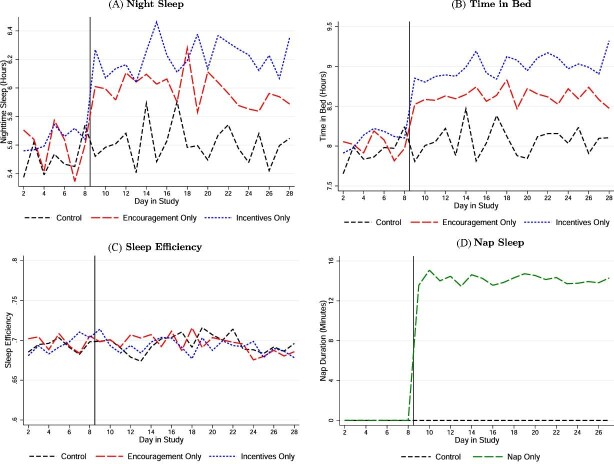
Figure V.
Impacts on Nighttime and Nap Sleep
This figure shows the average of different sleep-related variables for different treatment arms by day in study of the RCT. All outcomes are actigraph measures. We only include workday nights and days in the sample. In Panels A and B, we plot hours of night sleep and hours in bed at night, respectively. Panel C shows sleep efficiency (nighttime sleep/time in bed). In Panel D, we plot the duration of naps at the workplace (in minutes), excluding day 28 because naps were not allowed on that day.

