Figure 1.

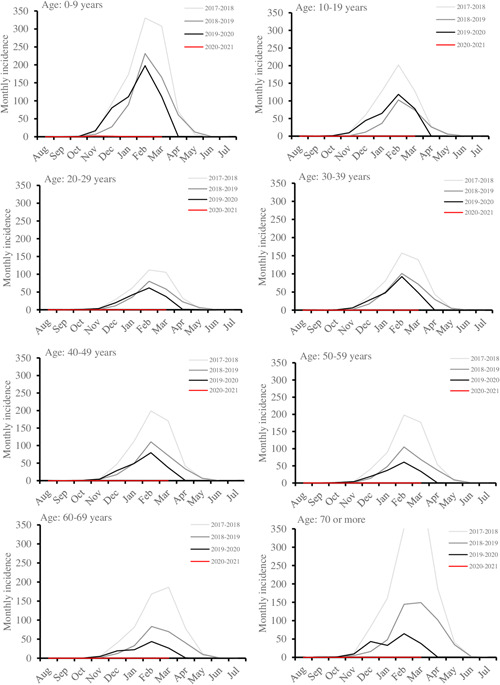
Monthly incidences per 100 000 persons of positive influenza A and B in Finland from August 2017 to March 2021. The data is stratified by age

Monthly incidences per 100 000 persons of positive influenza A and B in Finland from August 2017 to March 2021. The data is stratified by age