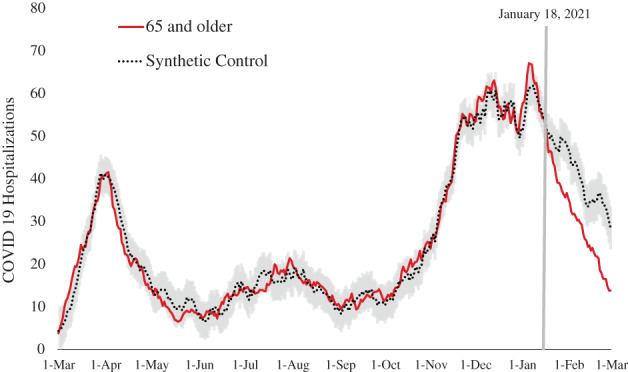
FIGURE 1.

Synthetic control (dotted line with 95% confidence intervals in gray) compared with the actual number of hospitalizations for the 65 and older age group (solid red line) during the entire period examined (March 1, 2020–March 1, 2021). The vertical line indicates January 18, 2021, the date when the 65 and older population was prioritized for COVID‐19
