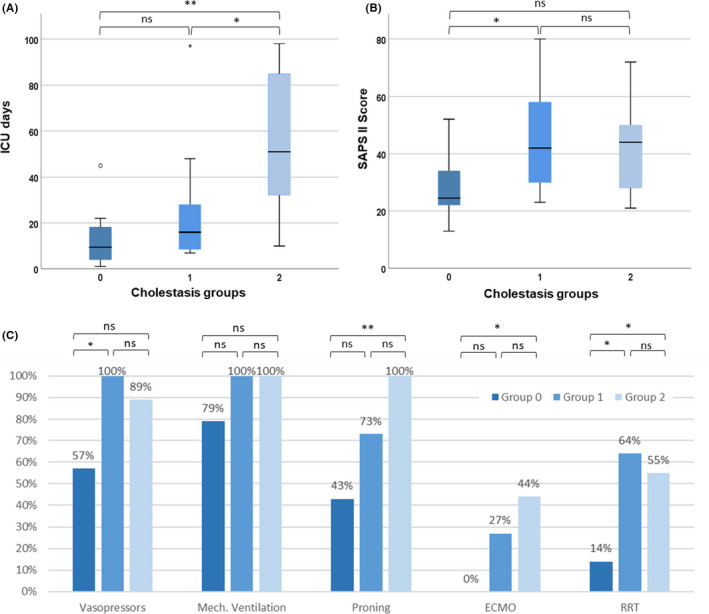
FIGURE 2.

ICU characteristics according to cholestasis groups of patients with COVID‐19 infection. A: ICU days among different groups. B: SAPS II score among different groups. Median (black bar), interquartile range (blue box) and 95% confidence interval (whiskers) are indicated. C: ICU treatments among different groups (percentages of patients receiving in each group). Statistical analysis: A/B: Mann‐Whitney U test. C: Fisher's exact. *P <.05, **P <.01, ***P <.001. ICU, Intensive care unit; SAPS II Score, Simplified Acute Physiology Score; ns, not significant
