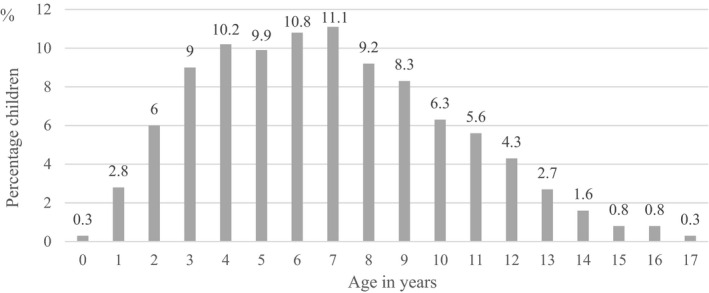
FIGURE 1.

Participants’ age (in years) distribution as percentages (N = 2,292). Participants’ (those aged 0–17 years) data distribution as percentages

Participants’ age (in years) distribution as percentages (N = 2,292). Participants’ (those aged 0–17 years) data distribution as percentages