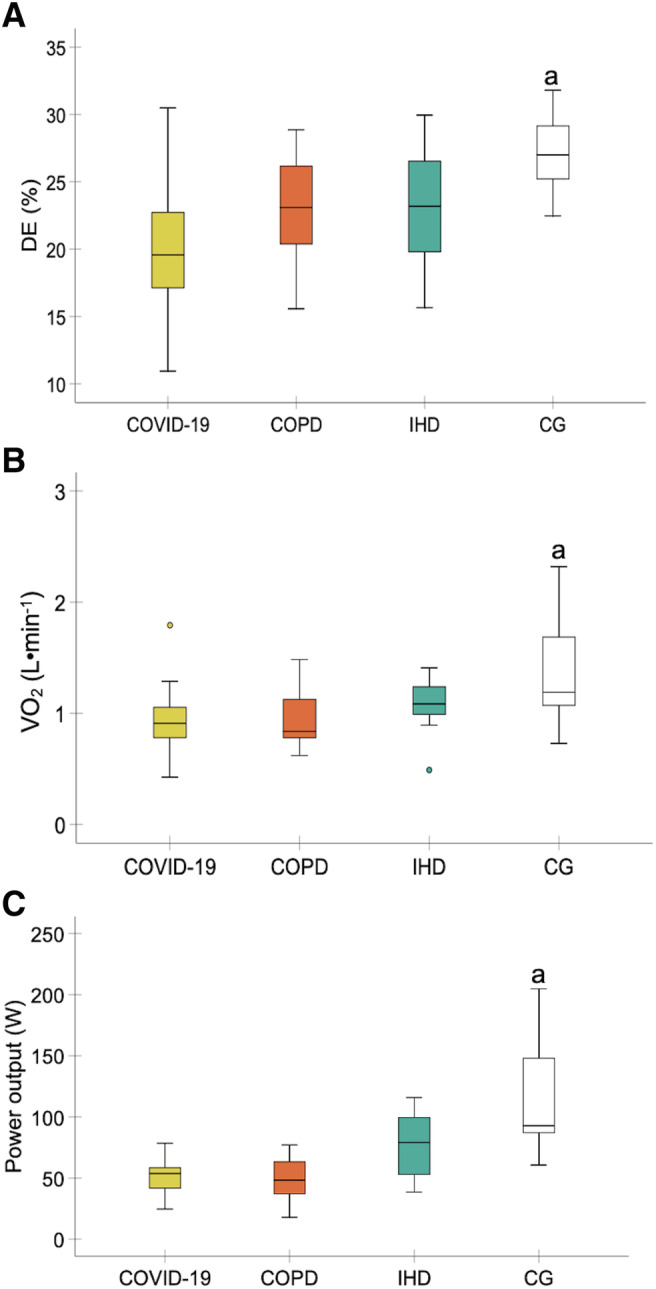
Figure 1.

Comparisons in delta efficiency (A), VO2 when the RER was 1 (B), and peak power when the RER was 1 (C) between the experimental groups. Abbreviations: CG, healthy control group; COPD, chronic obstructive pulmonary disease; DE, delta efficiency; IHD, ischaemic heart disease; RER, respiratory exchange ratio; VO2, oxygen uptake. aHigher DE, VO2, and peak power were detected in the healthy control group compared with the COVID‐19 and COPD groups (P < 0.05). (n = 15 each experimental group).
