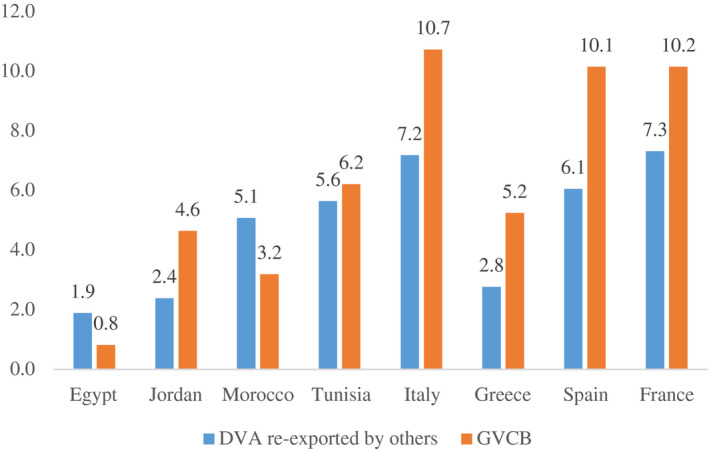
FIGURE 3.

GVCs backward and forward participation. Source: Authors' own elaboration using EORA dataset (Lenzen et al., 2012)
Notes: Values are in % of GDP

GVCs backward and forward participation. Source: Authors' own elaboration using EORA dataset (Lenzen et al., 2012)
Notes: Values are in % of GDP