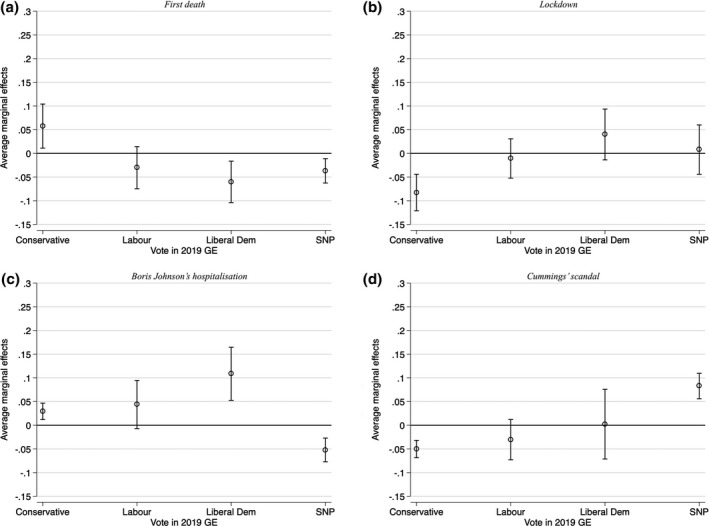
Figure 3.

Effect of events on government handling of economy, conditional on partisanship
Note: These figures plot the average marginal effects (with 95% confidence intervals) of each event, conditional on partisan affiliation, on the dependent variable (government handling of economy). The “Other” category was omitted from the graphs but was included in the regression specification.
