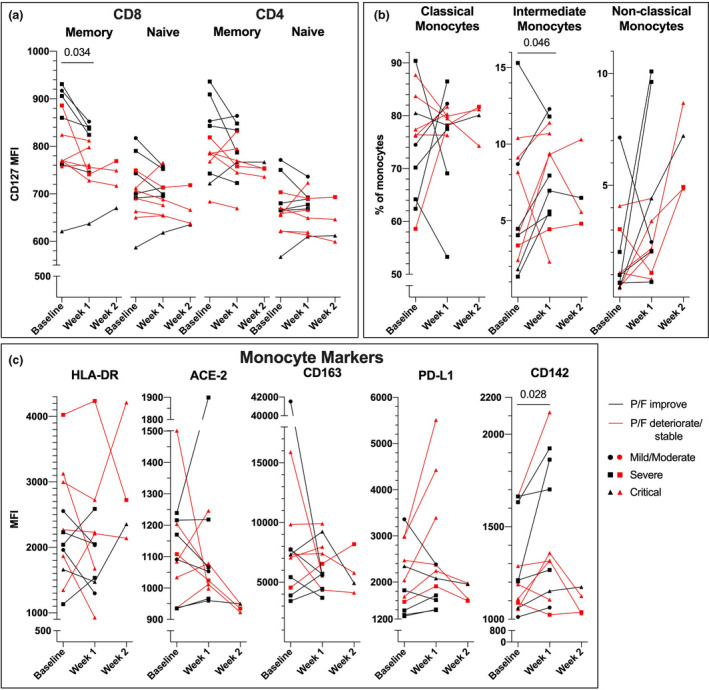
Fig. 3.

Dynamic changes in T cells and monocyte subsets during hospitalization in COVID‐19. (a) CD127/IL‐7Rα expression (mean fluorescence intensity; MFI) in T‐cell subsets, (b) monocyte subsets (%) and (c) expression (MFI) of monocyte markers (mHLA‐DR, ACE‐2, CD163, PD‐L1 and CD142) in COVID‐19 patients whose respiratory function (P/F) improved (n = 6, black line) or deteriorated/ remained stable (n = 6, red line) from baseline to week 1. Dot indicates mild/moderate (n = 1), square severe (n = 5) and triangle critical (n = 6) COVID‐19 severity; line represents mean value from each patient group. Significance calculated with Wilcoxon signed‐rank test including all patients from baseline to week 1 for all patients. No statistics were performed including data at week 2.
