Figure 2.

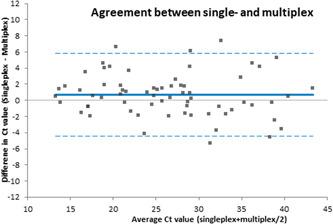
Bland–Altman plot with the difference in Ct value (multiplex–singleplex) on the Y‐axis and average of single‐ and multiplex on the X‐axis

Bland–Altman plot with the difference in Ct value (multiplex–singleplex) on the Y‐axis and average of single‐ and multiplex on the X‐axis